Learning Modules > Visualizing Tabular Data
Description | Usage Hints | Learning Task | Discussion | References | Acknowledgments
Description
TO BE POSTED
| Usage Hints |
Read How to Install, Compile, and Run the XML Toolkit and start the toolkit. Read the GRIDL and Fisheye Table documentation.
| Learning Task |
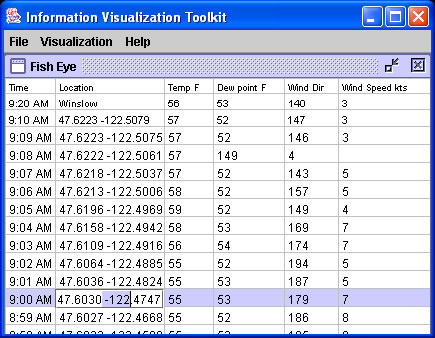
Click 'File > Open' and select the 'persisted_table.xml' file in the '/IVR/data' directory. Alternatively, open fisheye.xml. To display the data file you just load itusing the fisheye table, click 'Visualization > Fisheye Table' and a new window will open inside the IV Toolkit window showing the table in a distorted fashion. Mouse over the areas that you would to see in detail. Double click into any table field to edit its value.
| Discussion |
TO BE POSTED
| References |
See listed references for GRIDL and Fisheye.
| Acknowledgments |
This documentation was compiled by Katy Börner and Bruce William Herr. We would like to thank Renee LeBeau and Nathan James Deckard for their help in preparing the sample data sets and parsers.
![]()
Information
Visualization Cyberinfrastructure @ SLIS,
Indiana University
Last Modified May 12, 2004