Learning Modules > VxInsight Tutorial
Download Information | Working Directory | Data Preparation | Configuration | Layout Preparation | Loading Data | VxInsight Interaction | Interaction | References
According to its official site: "VxInsight(TM) is a tool for discovering relationships within large databases. While most data retrieval tools and most data mining tools are able to find information in a database, they only tell you about the data elements. VxInsight(TM) reveals the implicit structure of the data. VxInsight(TM) can help analysts uncover strategically important connections and patterns making it an important knowledge management tool." It provides good tools for connection analysis, layout rendering, 3-D visualization, and navigation. This software application is developed by Sandia National Laboratories: http://www.cs.sandia.gov/projects/VxInsight.html.
Please not that VxInsight is in US export control category EAR99. Students from these countries are prohibited from using it.
To use VxInsight, you need to have data of nodes and connections. The following steps will give you an example of how to prepare and load such data into VxInsight.
First of all, create a working directory (e.g. net/) where all the following data and configuration files will be created. |
|||
| Data Preparation |
|||
VxInsight takes various types of data sources, as long as they can be accessed through ODBC connections. MS Access database is commonly used with VxInsight.
To start, please create a MS Access .mdb file (net/net.mdb) in the working directory, create two tables, and load data into the tables. Assuming you have the following data (tables):
|
|
You may instead create two .txt files and use the "Import..." function in MS Access to build the tables and load the data easily. In addition, it is easy enough to copy data from Excel sheets to Access tables.
| Dataset Configuration |
For VxInsight to load the data, the following configuration files are needed:
1) Database Connection Configuration (net.db)
Id autoconnect*net.mdb::nodes::id cache Node autoconnect*net.mdb::nodes::node cache
Reference autoconnect*net.mdb::edges::id2 connection |
2) User Menu Configuration (net.config)
|
|
#
There are 3 commands availiable to the user
|
|
| Layout/coord Preparation |
| Now you should be able to load this data with VxInsight.
Yet there is a problem--VxInsight will visualize all the nodes at
one point. We need a layout for the visualization. Using VxOrd is
a good way to do so.
1) Firstly, prepare a text file with all connection edges. The file name should be *.ref if the network is directed; otherwise *.sim. The file is a tab-delimited file with 3 columns of the following form (sample file: net/net.ref):
Note that if you are using a *.ref file, the file should only be two columns (<node1> <tab> <node2>). VxOrd will calculate a *.sim file from the *.ref file using Henry Small's combined linkage formula (using direct, bib coupling, co-citation, and longitudinal coupling). Thus the *.ref file will give rise to a *.sim file with many, many more edges than the direct linkages in the *.ref file. If you are using *.sim file, only the edges in the *.sim file are used along with their given weights. 2) Then, load the file with VxOrd to produce a layout. You may adjust the parameters on its panel.
3) Lastly, use "Save coord file.." to
save this layout in the working directory (net/net.coord).
** If you want to use this layout with Pajek, simply
run the following shell scripts on Unix (e.g. ella):
wc -l net.coord | perl -pe
's/\s.*$//g;s/^/\*Vertices /g;$_=$_."\n"' > pajek.net
cat net.coord | awk '{printf("%s
node%s %s %s 0.0\n",$1,$1,$2,$3)}' >> pajek.net
The output can be visualized
with Pajek. Note: please use "Option->Transform->Fit
Area" menu if the nodes are drawn outside the drawing canvas
(where x, y should be between 0 and 1) and therefore invisible.
** To correlate more information with this layout,
you may load this layout data back to a database, join relevant
tables, retrieve information needed, and export the results to a
text file. However, this probably requires a separate tutorial.
|
|||

| Loading Data with VxInsight |
By now, your dataset is ready to be loaded into VxInsight:
1) Make sure .db, .conf, and .coord files are in the working directory and launch VxInsight;
2) Click menu "File->New..." and choose your .db (e.g. net/net.db);
3) If all of your settings in
the
4) To import coordinates into VxInsight, you need to either
- generate a coordinate file, choose TOOLS > IMPORT COORDINATES from the menu and use the .coord file you created (net/net.coord), OR
- have a SIM file, but have not generated a coordinate file, choose TOOLS > ORDINATE from the menu (net/net.sim).
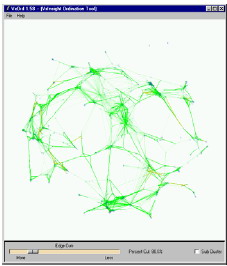
5) You should now see your data spread out in the landscape.
6) Choose FILE > SAVE from the menu to re-save your cache file with coordinates (net/net.cache will be created).
7) Now that your CACHE file is saved, you can reopen this cache any time you want to view the dataset.
| VxInsight Interaction |
|
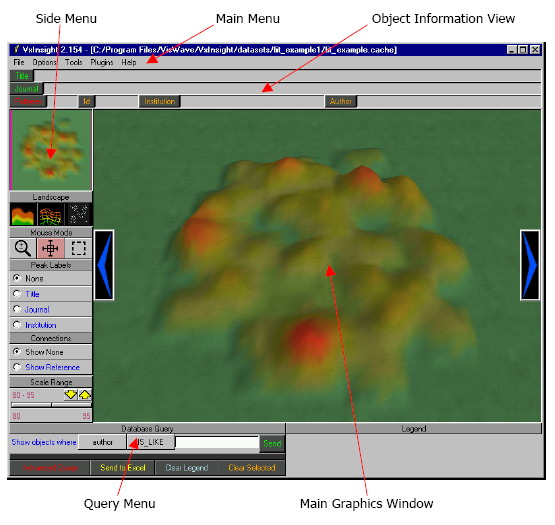
After loading data, VxInsight will look like this:
Object Information View: This menu shows detailed information (field data) of a selected node (as defined in a .config file, e.g. net/net.config).
Main Graphics Window: This window shows the primary visualization of the dataset. With it, you can zoom in/out, rotate (with the left and right button), and/or select a specific node to view its detail.
Side Menu: The following shows the side menu with the sample (net/) data loaded.
Query Menu:
With the query menu, you can send queries to the database and get results (subsets of the dataset) highlighted different colors. This feature helps you examine data subsets that you are interested in.
|
||||||||
|
||||||||
|
||||||||
This documentation was compiled by Weimao Ke & Kevin Boyack.
![]()
Information Visualization Cyberinfrastructure
@ SLIS, Indiana University
Last Modified Sept 26, 2005