Learning Modules > Visualizing Time Series Data
Description | Usage Hints | Learning Task | Discussion | References | Acknowledgments
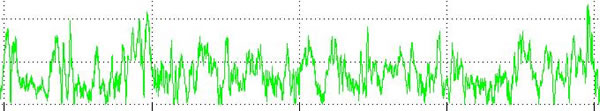
A time series is a sequence of events/observations which are ordered in one dimension- time. If successive observations depend on each other, it may make sense to display them in a [time] sorted fashion, e.g., as a scatter plot. Alternatively, one might want to know how many observations of a certain value have been made. In this case, one would sort the observations by value, count the number of observations for each value and derive a histogram. Time series data can be continuous, i.e., there is an observation at every instant of time (see figure below), or discrete, i.e., observations exist for regularly or irregularly spaced intervals.
Time series are recorded, analyzed and used in diverse domains of science. Check out the Time Series Data Library maintained by Rob Hyndman and Muhammad Akram for numerous data sets from a variety of fields: Agriculture, Chemistry, Crime, Demography, Ecology, Finance, Health, Hydrology, Industry, the Labor market, Macroeconomics, Meteorology, Microeconomics, Physics, Production, Sales, Simulated series, Sports, Transport & Tourism and Utilities.
| Usage Hints |
The InfoVis code repository provides two algorithms to analyze and interactively visualize time series data.
1.) Burst Detection
Please
read about Jon Kleinberg's burst detection algorithm.
Currently, the burst code can only be run in stand alone mode. We are in the process of making it available via the XML toolkit. The burst code utilizes a C program for efficiency reasons. Therefore, you can only run it under Unix.
You can run the code on a data file such as 'burst_sample_data' stored
in the 'IVR/data' directory by going to the main '/IVR' directory and
typing 'ant burst'. This will run a perl program that converts the input
file into the file format required by the burst code. The burst code
is started and will result in a file that has the form
^ W : a x r y (b1 - b2)
where W is the word associated with the burst, a is the number of bins
spanned by the burst interval, x is the weight of the burst, r is the
reciprocal of the rate associated with the burst state, and b1 and b2
are the names of starting and ending bins.
Note: If you feed the burst code a too short time slice then it is very likely that there will be no bursts detectable.
If you would like to analyze other data sets then check out Jon Kleinberg's sample results from the burst detection algorithm.
2.) Time Searcher
Please read about the TimeSearcher software
developed by Harry Hochheiser and Ben Shneiderman, University of Maryland.
TimeSearcher is a stand alone program that combines diverse visualizations for the analysis of time series data. It will not be integrated into the XML toolkit. If you are working on a Unix machine then go to the main '/IVR' directory and type 'ant timesearcher'. If you are working on a DOS machine and you are remotely logged into a Unix machine, then 'ant timesearcher' will not be able to open a window. You will have to use 'timesearcher.bat' in the '/IVR/bin' directory to run the software.
| Learning Task |
There are many time series data sets available from everyday
activities: Streams of emails arrive in your mailbox; Many papers are
published every day; People continuously log into and exit software systems
or real world places. Interestingly, most of those streams are threaded,
e.g., emails follow up on each other, papers cite each other, and people
follow their peers. Almost all of these streams exhibit times with little
or no activity and times with heavy activity. The identification and visualization
of the number and magnitude of threads or existing activity patterns often
results in surprising discoveries. For example, one could examine an increase
in SPAM and identify when most of the SPAM messages arrive. Alternatively,
one might be curious to identify activity patterns in project-related
communications.
Select a data set that you know well and decide which information you
need to keep. For example, if you decide to analyze emails, then for an
email like this one not everything needs
to be kept. Keeping this info
might suffice. Sometimes, you may not even want to go through the trouble
of analyzing the body of emails. Hence, a file that reports
Date | From | Subject | Content-Length
in a delimited format will do.
Please provide simple statistics to describe your data set. For emails,
you may wish to report the #emails, #posters, #recipients, time duration
covered, data fields kept, etc.
For example, Ning Yu analyzed the traffic from the katy_iv mailing list
for 10/22/2003, 4:57:50pm - 2/12/2004, 10:41:02am. Result: 191 messages
sent by 12 unique senders and frequencies as shown below.
The data file with 'Date|From|Subject|Content-length' information is available
here for a time series analysis.
Application of the burst detection algorithm
To analyze the katy_iv.txt email data
set introduced above, you would need to decide on a time code - in the
simplest case just count the months - and then reformat the data into
katy_iv-burst1.txt. You may
have to customize the perl script that reads the data (we can help with
this). For the katy_iv-burst1.txt
the code p_extract_burst_input.pl will work.
It generates katy_iv-burst2.txt
that serves as input to the burst algorithm. The result of the burst analysis
is rather surprising: katy_iv-burst3.txt.
Try to go for larger data sets, smaller time slices, and more text.
Application of TimeSearcher
Load timesearcher.tqd to examine the katy_iv.txt email data set introduced above.
A snapshot of the interface is shown below.
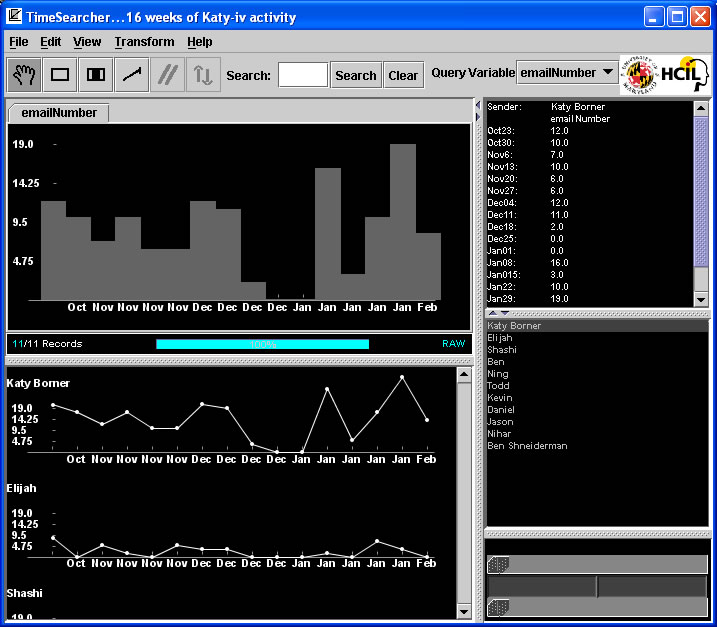 Click to enlarge
To prepare your own data sets for TimeSearcher, please follow
the instruction below:
1. Put your data in a delimited text file.
2. Run this perl script to read the input
file and transfer it to a TimeSearcher readable format:
perl p_codeTSfmt.pl <inputFileName>
<outputFileName>
3 . Now, you can run TimeSearcher to load the
output file, visualize it, and interact with it.
If you want to generate the TimeSearchable readable file by yourself, please make sure your data fields do not contain characters such as parenthesis, comma, and/or space.
| Discussion |
In this learning module you applied a data analysis algorithm and a visualization algorithms to make sense of a time series data set. Answer the subsequent questions for yourself:
- How well did the burst detection algorithm and TimeSearcher help you achieve your goals? What additional insights about your data did you gain?
- What information did you not obtain that you would have liked?
| References |
See references for the burst detection algorithm and TimeSearcher.
| Acknowledgments |
This documentation was compiled by Katy Börner and Bruce William Herr. We would like to thank Ketan Mane, Ning Yu, and Sidharth Thakur for their help in preparing the sample data sets and parsers.
![]()
Information Visualization Cyberinfrastructure
@ SLIS, Indiana University
Last Modified February 22, 2005