Software > Multidimensional Scaling
Description | Pros and Cons | Applications | Details | Usage Hints | References | Acknowledgments
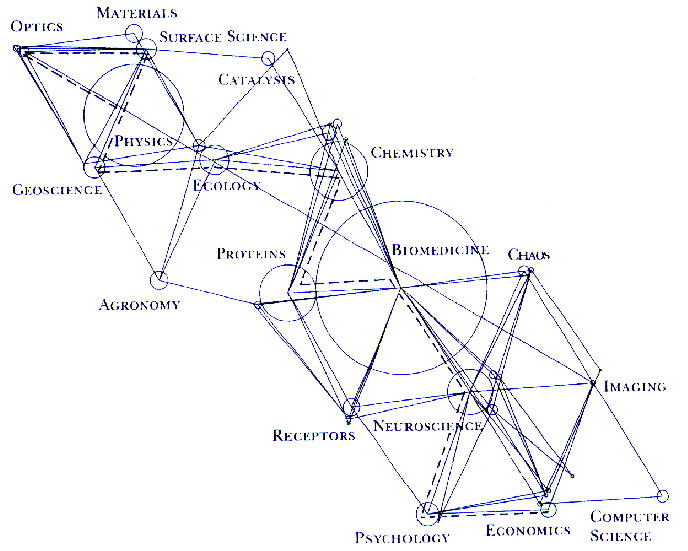
Small, H.: Visualizing science by citation mapping, 1999.
Small examined 36,720 multidisciplinary documents for a 15-year sampling window from 1981 through 1995. A combination of fractional citation counting and co-citation clustering via Multidimensional Scaling (MDS) was used to extract four nested levels of clustering via single and complete linkage. The documents have been arranged in 2D using an order-dependent, geometric triangulation process that produces a unified ordination of a hierarchical arrangement of documents.
| Description |
Multidimensional scaling (MDS) attempts to find the structure in a set of proximity measures between objects. This is accomplished by assigning observations to specific locations in a conceptual low-dimensional space such that the distances between points in the space match the given (dis)similarities as closely as possible. The result is a least-squares representation of the objects in that low-dimensional space, which, in many cases, will help you to further understand your data.
See http://www.analytictech.com/borgatti/mds.htm for an example input of distances between cities and the resulting MDS plot. MDS attempts to arrange "objects" (e.g. major cities) according to their distances in a space with a particular number of dimensions (e.g. two-dimensional) so as to reproduce the observed distances. As a result, we can "explain" the distances in terms of underlying dimensions (e.g. geographical dimensions: north/south and east/west). Note that the actual orientation of axes in the final solution is arbitrary (i.e. you can rotate the geographic map, the distances between cities remain the same). Thus, the final orientation of axes in the plane or space is mostly the result of a subjective decision by the researcher, who will choose an orientation that can be most easily explained.
Thus, MDS moves given objects around in the space defined by the requested number of dimensions, and checks how well the distances between objects can be reproduced by the new configuration. It uses a function minimization algorithm that evaluates different configurations with the goal of maximizing the goodness-of-fit.
The more dimensions we use in order to reproduce the distance matrix, the better is the fit of the reproduced matrix to the observed matrix (i.e., the stress is smaller). In fact, if we use as many dimensions as there are variables, then we can perfectly reproduce the observed distance matrix. However, the goal is to reduce the observed complexity of nature, that is, to explain the distance matrix in terms of fewer underlying dimensions. See (StatSoft, 2001) for details.
| Pros & Cons |
The "beauty" of MDS is that we can analyze any kind of distance or similarity matrix. These similarities can represent people's ratings of similarities between objects, the percent agreement between judges, the number of times a subjects fails to discriminate between stimuli, etc. For example, MDS methods used to be very popular in psychological research on person perception where similarities between trait descriptors were analyzed to uncover the underlying dimensionality of people's perceptions of traits. They are also very popular in marketing research, in order to detect the number and nature of dimensions underlying the perceptions of different brands or products (StatSoft, 2001).
Note that no relationships (links) are displayed.
| Applications |
- Cartia Themescape. NewsMaps.com http://www.newsmaps.com
- Author co-citation analysis in information science (White & McCain, 1998) - 12 key journals between 19972 and 1995 were analyzed and INDSCAL (Individual differences MDS) was used to identify trends in terms of top-cited authors.
- Map of Science (Small, 1999) - see Figure.
- XGvis: Interactive Data Visualization with Multidimensional Scaling (Guja et al., 1998). Source code & link to ArcView available.
- PaVIS by Wojciech Basalaj (Jan 2001) Proximity Visualization of Abstract Data - Website devoted to visualization of abstract data collections, like graphs, multivariate data tables, or sets of multimedia objects. Icons representing objects from a collection are positioned such that proximity relationships within the collection are preserved, i.e. icons for similar objects are clustered, and separated from the dissimilar ones. Examples used include MDS (multidimensional scaling).
- Interactive Visualization of Hierarchical Clusters Using MDS and MST (Kim et al., 1998) code available.
- Multidimensional Scaling
for Group Memory Visualization (McQuaid et al., 1999)
MDS demo, University of Arizona http://ai.bpa.arizona.edu/go/viz/mds.html
| Details |
The MDS procedure is as follows:
- Determine all objects and their distances.
- Use MDS to produce a scatterplot of the objects in a n-dimensional space (typical 2-D).
- Interpret the dimensions keeping in mind that the actual orientations of the axes from the MDS analysis are arbitrary, and can be rotated in any direction. In addition, look for clusters of points or particular patterns and configurations (such as circles, manifolds, etc.).
Recently, the code by Morrison et al. (2003) was integrated into the repository.
| Usage Hints |
You can use SPSS's Multidimensional
Scaling. Load data and choose from the menus: Analyze -> Scale -> Multidimensional Scaling.
As an example, you may use MDS to visualize the slis-courses.sim matrix created via LSA.
| References |
- Morrison, A., G. Ross, and M. Chalmers (2003). Fast multidimensional scaling through sampling, springs and interpolation. Information Visualization, 2, 68-77.
- Buja, A., Swayne, D. F., Littman, M. L., Dean, Nathaniel. (1998) XGvis: Interactive Data Visualization with Multidimensional Scaling. http://lib.stat.cmu.edu/general/XGobi/
- Kim, Sung Soo, Kwon, Sunhee, and Cook, Dianne (1998) Interactive Visualization of Hierarchical Clusters Using MDS and MST. pdf
- Kruskal, J.B. (1964) Multidimensional scaling: A numerical method. Psychometrica, 29, 115-129.
- Kruskal, J.B. and M. Wish (1978) Multidimensional scaling. Beverly Hills, CA: Sage University Series.
- McQuaid, M., Ong, T., Chen, H., & Nunamaker, J. F. (1999) Multidimensional scaling for group memory visualization. Decision Support Systems, 27, 163-176.
- StatSoft (2001) Multidimensional Scaling, http://www.statsoftinc.com/textbook/stmulsca.html
- Stewyvers, M. (2000) Nonmetric Multidimensional Scaling (MDS) software, http://boreas.psych.indiana.edu/Matlab/nonmetricmds.htm
- Small, H. (1999) Visualizing science by citation mapping. Journal of the American Society for Information Science, 50(9), 799-813.
- White, H. D. and McCain, K. W. (1998) Visualizing a discipline: An author co-citation analysis of information science, 1972-1995. Journal of the American Society for Information Science, 49(4), 327-355.
- Young, F.W. & Hamer,
R.M. (1987) Multidimensional Scaling: History, Theory and Applications.
New York: Erlbaum.
| Acknowledgments |
Matthew Chalmers and Alistair Morrison provided the fast non-linear MDS algorithm. The code was integrated into the XML toolkit by Sriram Raghuraman.
![]()
Information
Visualization Cyberinfrastructure @ SLIS,
Indiana University
Last Modified January
14, 2004